

 1 week ago
3
1 week ago
3
PROTECT YOURSELF with Orgo-Life® QUANTUM TECHNOLOGY
Orgo-Life the new way to the future Advertising by Adpathway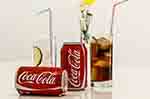 Cola carbonated drinks
International sales of exported soft drinks in 2025 totaled US$32.9 billion.
The global value of soft drinks shipped rose by an average 22.9% for all exporting countries compared to 5 years earlier in 2021 when soft drinks sold internationally were valued at $26.8 billion.
Year over year, the global value of exported soft drinks increased by 5.4% compared to $31.3 billion starting from 2024.
The 6 biggest exporters of soft drinks are Germany, Austria, Netherlands, United States of America, Thailand and Switzerland. Together, that powerful cohort of suppliers over two-fifths (42.4%) of international sales of pertinent beverage commodities in 2025.
An ever-expanding myriad of flavors are quenching the thirst of soft drink enthusiasts around the globe. Consumers continue to indulge in tastes ranging from non-alcoholic beer, bubble gum and plum to curry and teriyaki carbonated drinks.
Drilling down within the overall soft drinks’ category, global export revenues from carbonated soft drinks were worth $17 billion for 2025 (or 51.7% of the overall category total). That dollar amount represents a 37.9% acceleration for the carbonated subcategory since 2021 and a 5.1% advance from 2024 to 2025.
From a continental perspective, suppliers located in European countries generated the highest international sales for all types of soft drinks during 2025 with shipments valued at $21.2 billion or approaching two-thirds (64.4%) of the worldwide total. In second place were exporters located in Asia at 18.8% while another 10.7% of globally exported soft drinks originated from North America.
Smaller percentages came from sellers in Africa (2.8%), Latin America (2.4%) excluding Mexico but including the Caribbean, and Oceania (0.9%) mainly Australia and New Zealand.
For research purposes, the four-digit Harmonized Tariff System code prefix is 2202 for soft drinks. The subcategory code for carbonated soft drinks is 220240.
Below are the 15 countries that exported the highest dollar value worth of soft drinks during 2025.
- Germany: US$3.4 billion (10.5% of exported soft drinks)
- Austria: $3 billion (9%)
- Netherlands: $2.7 billion (8.3%)
- United States: $1.7 billion (5.2%)
- Thailand: $1.56 billion (4.7%)
- Switzerland: $1.53 billion (4.6%)
- Belgium: $1.4 billion (4.2%)
- Mexico: $1.3 billion (3.8%)
- France: $1.2 billion (3.6%)
- Italy: $1 billion (3.2%)
- Poland: $984.4 million (3%)
- United Kingdom: $915.5 million (2.8%)
- Spain: $862.3 million (2.6%)
- Denmark: $747.9 million (2.3%)
- South Korea: $735.3 million (2.2%)
By value, the listed 15 countries shipped 70.1% of all soft drinks exported in 2025.
Among the top exporters, the fastest-growing soft drinks exporters since 2024 were: Spain (up 25.5%), Belgium (up 23.8%), United Kingdom (up 13.7%) and Italy (up 13%).
Those countries that posted year-over-year declines in their exported soft drinks sales were: Thailand (down -5.9%), South Korea (down -5.1%), Switzerland (down -1.3%) and Austria (down -0.6%).
The 100 key exporters of soft drinks showcased in the automated database below represent 99.7% of the total value for globally exported soft drink beverages during 2025.
| 1 | Germany | $3,449,052,000 | +12.4% |
| 2 | Austria | $2,968,112,000 | -0.6% |
| 3 | Netherlands | $2,747,078,000 | +5.9% |
| 4 | United States | $1,701,093,000 | +7.8% |
| 5 | Thailand | $1,560,132,000 | -5.9% |
| 6 | Switzerland | $1,528,703,000 | -1.3% |
| 7 | Belgium | $1,399,424,000 | +23.8% |
| 8 | Mexico | $1,263,356,000 | +2.8% |
| 9 | France | $1,173,214,000 | +12.2% |
| 10 | Italy | $1,048,390,000 | +13% |
| 11 | Poland | $984,351,000 | +4.5% |
| 12 | United Kingdom | $915,537,000 | +13.7% |
| 13 | Spain | $862,254,000 | +25.5% |
| 14 | Denmark | $747,865,000 | +12.4% |
| 15 | South Korea | $735,301,000 | -5.1% |
| 16 | mainland China | $573,531,000 | +17.8% |
| 17 | Canada | $560,006,000 | -2.7% |
| 18 | Hungary | $472,323,000 | +9.6% |
| 19 | Japan | $404,185,000 | +6.4% |
| 20 | Saudi Arabia | $397,793,000 | +20.3% |
| 21 | Czech Republic | $389,092,000 | +4.6% |
| 22 | South Africa | $366,093,000 | +25.2% |
| 23 | Serbia | $348,766,000 | +9.9% |
| 24 | Türkiye | $327,945,000 | +5.7% |
| 25 | Malaysia | $306,053,000 | +0.7% |
| 26 | Sweden | $275,402,000 | +26.2% |
| 27 | Vietnam | $244,811,000 | +4.6% |
| 28 | Kazakhstan | $225,484,000 | +12.1% |
| 29 | Ireland | $219,106,000 | +15.5% |
| 30 | Indonesia | $214,022,000 | +50.1% |
| 31 | Portugal | $206,859,000 | +4.6% |
| 32 | Romania | $204,098,000 | -10.9% |
| 33 | Guatemala | $188,958,000 | -6.9% |
| 34 | Zambia | $182,059,000 | +25.6% |
| 35 | Hong Kong | $180,470,000 | -1.8% |
| 36 | Taiwan | $175,172,000 | -11.3% |
| 37 | Georgia | $166,210,000 | +21.1% |
| 38 | Slovakia | $165,416,000 | +13.3% |
| 39 | El Salvador | $156,000,000 | -1.1% |
| 40 | Russia | $155,417,000 | -39.3% |
| 41 | Australia | $148,741,000 | +8.4% |
| 42 | New Zealand | $148,290,000 | -25.9% |
| 43 | Slovenia | $141,894,000 | +27.4% |
| 44 | Croatia | $132,505,000 | +2.9% |
| 45 | United Arab Emirates | $107,127,000 | -49.3% |
| 46 | Greece | $100,709,000 | +5.1% |
| 47 | Trinidad/Tobago | $97,672,000 | -11.9% |
| 48 | India | $92,180,000 | +3.5% |
| 49 | Tanzania | $91,189,000 | +19.5% |
| 50 | Ukraine | $86,645,000 | +0.4% |
| 51 | Lithuania | $80,782,000 | +8.6% |
| 52 | Bulgaria | $74,170,000 | +3.5% |
| 53 | Uzbekistan | $66,770,000 | +55.3% |
| 54 | Luxembourg | $58,122,000 | +16.3% |
| 55 | Singapore | $54,871,000 | -30.9% |
| 56 | Nepal | $54,768,000 | -11.2% |
| 57 | Latvia | $52,890,000 | +25.8% |
| 58 | Costa Rica | $50,370,000 | -12% |
| 59 | Senegal | $50,168,000 | +30.8% |
| 60 | Uganda | $49,170,000 | +22.8% |
| 61 | Finland | $49,075,000 | +6.5% |
| 62 | Honduras | $43,685,000 | +41.7% |
| 63 | Colombia | $40,413,000 | +23.3% |
| 64 | Azerbaijan | $40,207,000 | +16.3% |
| 65 | Bangladesh | $38,805,000 | -15.3% |
| 66 | Brazil | $38,653,000 | -8.8% |
| 67 | Jamaica | $35,027,000 | -4.8% |
| 68 | Dominican Republic | $33,852,000 | +6.9% |
| 69 | Sri Lanka | $33,063,000 | -25.1% |
| 70 | Peru | $32,376,000 | +15% |
| 71 | Bosnia/Herzegovina | $30,684,000 | -13.2% |
| 72 | Cyprus | $29,055,000 | +14.8% |
| 73 | Morocco | $28,397,000 | -0.1% |
| 74 | Estonia | $26,756,000 | +31.8% |
| 75 | Armenia | $25,130,000 | +53.4% |
| 76 | Oman | $22,810,000 | +20% |
| 77 | Afghanistan | $22,020,000 | -41.3% |
| 78 | Egypt | $21,166,000 | -30.6% |
| 79 | Argentina | $20,004,000 | -18.3% |
| 80 | Rwanda | $19,057,000 | +56.7% |
| 81 | Nigeria | $18,707,000 | +447.6% |
| 82 | Algeria | $18,160,000 | -32.8% |
| 83 | Burkina Faso | $18,031,000 | +39.4% |
| 84 | Iraq | $15,035,000 | -40.2% |
| 85 | Nicaragua | $14,107,000 | -30.8% |
| 86 | Norway | $13,867,000 | -2.8% |
| 87 | Kenya | $13,570,000 | +2.6% |
| 88 | North Macedonia | $13,183,000 | -68.9% |
| 89 | Albania | $12,978,000 | -21.8% |
| 90 | Tajikistan | $12,570,000 | -5.4% |
| 91 | Ghana | $11,718,000 | -39.6% |
| 92 | Philippines | $11,441,000 | +3.4% |
| 93 | Iran | $11,416,000 | -40.9% |
| 94 | Chile | $9,545,000 | +43.7% |
| 95 | Togo | $9,399,000 | +33% |
| 96 | Tunisia | $9,304,000 | -28.4% |
| 97 | Kyrgyzstan | $8,170,000 | +95.9% |
| 98 | Lebanon | $8,137,000 | -73.5% |
| 99 | Jordan | $7,984,000 | +9.6% |
| 100 | Malta | $7,917,000 | +15.7% |
Focusing on the 100 suppliers of soft drinks on international markets, the strongest gainers were Nigeria (up 447.6% from 2024), Kyrgyzstan (up 95.9%), Rwanda (up 56.7%), Uzbekistan (up 55.3%) then Armenia (up 53.4%).
Countries Generating Largest Trade Surpluses from Soft Drinks
The following countries posted the highest positive net exports for soft drinks during 2025. Investopedia defines net exports as the value of a country’s total exports minus the value of its total imports. Thus, the statistics below present the surplus between the value of each country’s exported soft drinks and its import purchases for that same commodity.
- Austria: US$2.1 billion (net export surplus down -21.5% since 2024)
- Thailand: $1.5 billion (down -2.8%)
- Netherlands: $1.4 billion (down -4.7%)
- Mexico: $1.07 billion (up 71.8%)
- Germany: $1.05 billion (up 89.6%)
- Switzerland: $1.01 billion (down -36.2%)
- South Korea: $600.9 million (up 25.9%)
- Italy: $537.5 million (up 6.5%)
- Denmark: $477.2 million (up 83.9%)
- Spain: $314.1 million (up 125.7%)
- Poland: $295.1 million (up 29.5%)
- Saudi Arabia: $287.4 million (up 451.4%)
- Hungary: $261.8 million (up 157.7%)
- Serbia: $248 million (up 93.6%)
- South Africa: $197.1 million (up 199.4%)
Austria generated the highest surplus in the international trade of soft drinks. In turn, this positive cashflow confirms Austria’s competitive advantage for this specific product category.
Countries Experiencing Worst Trade Deficits from Soft Drinks
The following countries posted the highest negative net exports for soft drinks during 2025. Investopedia defines net exports as the value of a country’s total exports minus the value of its total imports. Thus, the statistics below present the deficit between the value of each country’s imported soft drinks purchases and its exports for that same commodity.
- United Kingdom: -US$1.5 billion (net export deficit up 137.7% since 2024)
- United States: -$1.3 billion (down -48.8%)
- Canada: -$654.1 million (up 16.6%)
- mainland China: -$562.3 million (down -18.2%)
- Vietnam: -$410.9 million (up 241.6%)
- Norway: -$333.1 million (up 6.6%)
- Ireland: -$328.8 million (up 44.4%)
- Sweden: -$308.9 million (up 202.5%)
- Russia: -$306 million (down -502.9%)
- Philippines: -$296 million (up 152.4%)
- Singapore: -$287.1 million (up 54.8%)
- Myanmar: -$278.7 million (up 169.9%)
- Hong Kong: -$236.9 million (up 28.9%)
- Brazil: -$223.8 million (up 158.4%)
- Finland: -$223.3 million (up 56.5%)
The United Kingdom and the United States of America incurred the highest deficits in the international trade of soft drinks. In turn, this negative cashflow highlights both economies’ strong competitive disadvantages for this specific product category but also signals opportunities for soft drinks suppliers that help satisfy the powerful demand among consumers.
Soft Drinks Exporting Companies
Below are global producers that represent established players that dominate the international soft drinks trade. The country that is home to each conglomerate’s headquarters is shown within parenthesis.
- Asahi Soft Drinks (Japan)
- Britvic plc (United Kingdom)
- Cott (Canada)
- Dr Pepper Snapple Group (United States)
- Drinko (Lebanon)
- Faygo Beverages, Inc (United States)
- Fraser and Neave, Limited (Singapore)
- Hamoud Boualem (Algeria)
- Jones Soda (United States)
- PepsiCo Inc (United States)
- Perrier (France)
- Sumal + Compal SA (Portugal)
- The Coca-Cola Company (United States)
- Vitasoy (Hong Kong)
See also Coffee Exports by Country, Tea Imports by Country, Sugar Exports by Country, Natural Honey Exports by Country and Top Milk Exporting Countries
Research Sources:
Central Intelligence Agency, The World Factbook Field Listing: Exports – Commodities. Accessed on August 26, 2026
International Trade Centre, Trade Map. Accessed on August 26, 2026
Investopedia, Net Exports Definition. Accessed on August 26, 2026
Wikipedia, List of soft drink producers. Accessed on August 26, 2026






















 English (US) ·
  French (CA) ·
  French (FR) ·