

 1 week ago
6
PROTECT YOURSELF with Orgo-Life® QUANTUM TECHNOLOGY
Orgo-Life the new way to the future Advertising by Adpathway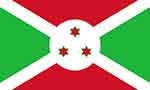 Burundi flag
An East African landlocked country that is also considered part of Central Africa, the Republic of Burundi shipped US$341.1 million worth of exported products around the world in 2025.
That dollar amount results from a 201.4% acceleration from 5 years earlier in 2021 when Burundi’s overall exports were worth $113.2 million.
Year over year, overall sales for Burundian exported goods accelerated by 84.9% compared to $184.4 million starting from 2024.
Based on the average exchange rate for 2025, Burundi’s legal currency is the Burundian franc which appreciated by 33.2% against the US dollar since 2021 and strengthened by 2.5% from 2024 to 2025. Its stronger local currency in 2025 made Burundian exports paid for in weaker US dollars relatively more expensive for international buyers starting with American currency.
Burundi’s Major Trading Partners
The latest available country-specific data shows that 92.7% of products exported from Burundi was bought by importers in: United Arab Emirates (35.6% of the Burundian total), Burundi (24.1%), Democratic Republic of the Congo (13.4%), Belgium (4.7%), Switzerland (3.2%), mainland China (3.1%), Germany (2.4%), Sudan (2.2%), Oman (1.4%), Tanzania (0.98%), Canada (0.92%) and the United States of America (0.8%).
From a continental perspective, 44.5% of Burundi’s exports by value was delivered to fellow African countries while 42.2% was sold to importers in Asia.
Burundi shipped another 11.3% worth of goods to buyers in Europe.
Tinier percentages went to customers in North America (1.7%), Oceania’s New Zealand and Australia (0.3%) then Latin America’s Colombia only (0.0003%).
Given Burundi’s population of 13.8 million people, its total US$341.1 million in 2025 exports translates to roughly $25 for every resident in the central eastern African country. That dollar metric exceeds the average $15 per capita one year earlier during 2024.
The following export product groups represent the highest dollar value in Burundian global shipments during 2025. Also shown is the percentage share each export category represents in terms of overall exports from Burundi.
- Gems, precious metals: US$138.4 million (40.6% of total exports)
- Coffee, tea, spices: $90.7 million (26.6%)
- Beverages, spirits, vinegar: $22.4 million (6.6%)
- Ores, slag, ash: $19.5 million (5.7%)
- Tobacco, manufactured substitutes: $12.2 million (3.6%)
- Milling products, malt, starches: $8.9 million (2.6%)
- Mineral fuels including oil: $8.2 million (2.4%)
- Plastics, plastic articles: $5.2 million (1.5%)
- Glass: $4.9 million (1.4%)
- Fruits, nuts: $4.5 million (1.3%)
Burundi’s top 10 export product categories accounted for 92.3% of the overall value of its global shipments.
Gems and precious metals represent the fastest grower among the top 10 export categories, up by 328.2% from 2024 to 2025.
In second place for improving export sales was the coffee, tea and spices grouping via a 121.4% advance led by coffee.
Burundi’s shipments of mineral fuels including oil posted the third-fastest gain in value, up by 95.8%.
The leading decliner among Burundi’s top 10 export categories were milling products, malt and starches, thanks to a -39.2% year-over-year drop.
The above listed product categories are at the two-digit Harmonized Tariff System (HTS) code level.
Drilling down to the more granular four-digit HTS codes, unwrought gold achieved status as Burundi’s most valuable exported product at 40.4% of the African country’s total for 2025. In second place was coffee (22.9%) trailed by malt beer (5.5%), tin ores and concentrates (5.4%), tea including flavored versions (3.7%), cigarettes and cigars (3.6%), wheat or meslin flour (2.5%), processed petroleum oils (2.2%), glass bottles, flasks, jars and other containers (1.4%) then plastic packing goods, lids and caps (also 1.4%).
Products Generating Burundi’s Best Trade Surpluses
The following types of Burundian product shipments represent positive net exports or a trade balance surplus. Investopedia defines net exports as the value of a country’s total exports minus the value of its total imports.
In a nutshell, net exports is the amount by which foreign spending on a home country’s goods or services exceeds or lags the home country’s spending on foreign goods or services.
The product categories below generated the greatest surplus amounts for Burundi.
- Gems, precious metals: US$138.3 million (Up by 328.2% since 2024)
- Coffee, tea, spices: $89.2 million (Up by 223.9%)
- Ores, slag, ash: $19.4 million (Up by 18.7%)
- Fruits, nuts: $4.2 million (Up by 47.6%)
- Tobacco, manufactured substitutes: $3.6 million (Up by 85.3%)
- Raw hides, skins not furskins, leather: $960,000 (Up by 75.2%)
- Other base metals: $228,000 (Reversing a -$10,000 deficit)
- Zinc: $22,000 (Up by 266.7%)
- Live trees, plants, cut flowers: $19,000 (Down by -36.7%)
- Woodpulp: $5,000 (Down by -16.7%)
Burundi has highly positive net exports in the international trade of gold. In turn, positive cashflows indicate Burundi’s strong competitive advantages under the gems and precious metals product category.
Products Causing Burundi’s Worst Trade Deficits
Burundi incurred an overall -US$971 million trade deficit for 2025, reducing by -10.4% from -$1.1 billion in red ink one year earlier in 2024.
Below are exports from Burundi that result in negative net exports or product trade balance deficits. These negative net exports reveal product categories where foreign spending on home country Burundi’s goods trail Burundian importer spending on foreign products.
- Mineral fuels including oil: -US$180.6 million (Down by -34% since 2024)
- Fertilizers: -$137.4 million (Up by 116.7%)
- Vehicles: -$99.3 million (Up by 6.3%)
- Electrical machinery, equipment: -$69.1 million (Up by 1.9%)
- Iron, steel: -$63.2 million (Up by 40.8%)
- Machinery including computers: -$62.9 million (Down by -3.8%)
- Pharmaceuticals: -$47.2 million (Up by 5.9%)
- Miscellaneous textiles, worn clothing: -$45.7 million (Up by 52.9%)
- Plastics, plastic articles: -$40.9 million (Up by 2.6%)
- Arms, ammunition: -$40.4 million (Up by 2,156%)
Burundi has highly negative net exports and therefore deep international trade under the mineral fuels including oil product category.
Burundian Export Companies
Not one Burundian corporation ranks among the Forbes Global 2000.
Wikipedia lists businesses from Burundi that participate in international trade transactions. Selected examples are shown below.
- Air Burundi (airliner)
- Brarudi (brewery)
- FinBank Burundi (commercial bank)
- Interbank Burundi (commercial bank)
- KCB Bank Burundi Limited (commercial bank)
In macroeconomic terms, Burundi’s total exported goods represent an estimated 2.4% of its overall Gross Domestic Product for 2025 ($14 billion valued in Purchasing Power Parity US dollars). That 2.4% for exports to overall GDP in PPP for 2025 compares to 1.4% for 2024. Those percentages suggest a relatively increasing reliance on products sold on international markets for Burundi’s total economic performance, albeit based on a relatively short timeframe.
One lagging indicator for economic health is a country’s jobless rate. Burundi’s unemployment rate averaged 0.9% for 2025, same as an average 0.9% during 2024 according to Trading Economics’ metrics.
Burundi’s capital city is Bujumbura.
See also Democratic Republic of the Congo’s Top 10 Exports, Uganda’s Top 10 Exports, Somalia’s Top 10 Exports and Top African Export Countries
Research Sources:
Central Intelligence Agency, The World Factbook Country Profiles. Accessed on October 30, 2026
Forbes Global 2000 rankings, The World’s Biggest Public Companies. Accessed on October 30, 2026
International Monetary Fund, Exchange Rates selected indicators (Domestic Currency per U.S. dollar, period average). Accessed on October 30, 2026
International Monetary Fund, World Economic Outlook Databases (GDP based on Purchasing Power Parity). Accessed on October 30, 2026
International Trade Centre, Trade Map. Accessed on October 30, 2026
Investopedia, Net Exports Definition. Accessed on October 30, 2026
Wikipedia, Burundi. Accessed on October 30, 2026
Wikipedia, Flag of Burundi. Accessed on October 30, 2026
Wikipedia, List of Companies of Burundi. Accessed on October 30, 2026



















 English (US) ·
 French (CA) ·
 French (FR) ·